Considerations for Mass-Directed Purification
While traditional peptide isolation is generally performed using UV detection, mass-directed isolation makes the purification process easier with less ambiguous discrimination between the target peptide and the contaminants formed during synthesis and cleavage. Mass detection can be used to assess peak identity and homogeneity in complex chromatograms and increases sample throughput. Developing a separation that encompasses both mass and UV detection ensures a more complete chromatographic sample profile. Compounds that do not ionize, or ionize poorly, will often be detected with low wavelength UV. Conversely, peptides with very low UV extinction will usually be readily detected with MS.
Solvents
Solvents commonly used in peptide isolation, including acetonitrile, methanol, ethanol, and isopropanol, are all compatible with electrospray (ESI) and other atmospheric ionization techniques. However, acetonitrile generally gives the best resolution, selectivity, peak symmetry, and efficiency.6 The lower viscosity of acetonitrile also reduces LC system backpressure when used for chromatographic isolations. Volatility, as well as the solvent’s ability to donate protons, are both important for ESI. Volatile organic solvents reduce the surface tension of the droplets formed in the MS source, which promotes better ionization and increased sensitivity.30 Many peptides are analyzed and isolated using acidic modifiers, such as formic acid or trifluoroacetic acid, although TFA does suppress ionization to some extent. If positive-negative switching is required for method development, then ammonium acetate or ammonium formate mobile-phases are acceptable, MS-friendly choices. For peptides better separated at high pH, mobile- phases made with ammonium bicarbonate are suitable. To reduce the possibility of precipitation in the mass detector, volatile buffers should be used at concentrations of 20 mM or less.
Managing Detection
Special considerations must be given to detection in preparative chromatography. The highly concentrated peaks exceed the linear range of most detectors and high flow rates are not compatible with detector hardware. Some detectors, like MS and ELSD, are destructive. It is, therefore, necessary to effectively reduce the flow and concentration reaching the detectors while minimizing sample loss. A passive flow splitter is commonly used to split and dilute the sample before it reaches the detectors (Figures 47 and 48). A make-up solvent dilutes the prep stream sampling and transfers it to the detectors.
Passive splitters are manufactured to be used with a specific chromatographic flow rate range and split ratio. The splitter fluidics must be matched to the flow rate appropriate to the selected column. Higher split ratios are used where the peaks elute at higher concentration. Commonly used flow splitters and their split ratios are shown in Table 6.
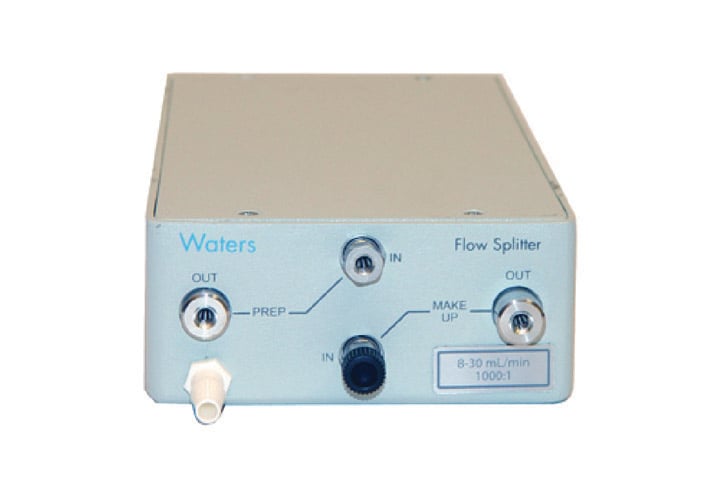
Figure 47: Passive splitter.
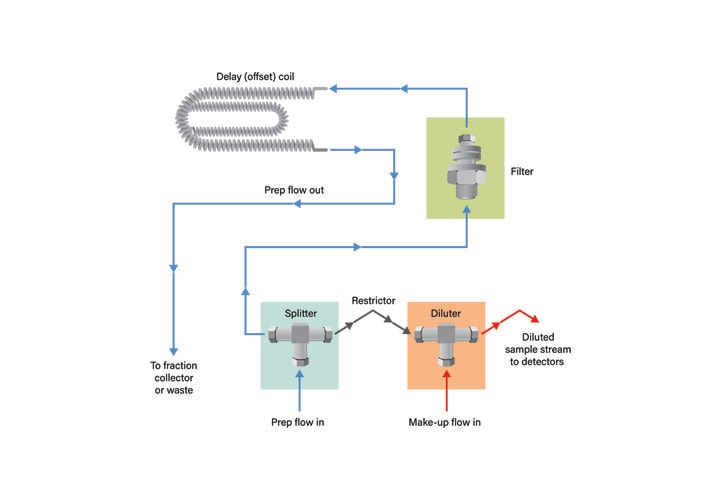
Figure 48: Flow diagram for passive splitter.
|
Splitter Part Number
|
Flow Rate Range (mL/min)
|
Split Ratio
|
Target Column
|
|
205000435
|
0.5-2.0
|
15:1
|
4 mm
|
|
205000436
|
2.0-8.0
|
100:1
|
10 mm
|
|
205000437
|
8.0-30
|
1,000:1
|
19 mm
|
|
205000438
|
8.0-30
|
5,000:1
|
19 mm
|
|
205000439
|
30-100
|
5,000:1
|
30 mm
|
|
205000440
|
100-150
|
10,000:1
|
50 mm
|
Table 6: Passive splitters available from Waters.
As an alternative to passive flow splitting, an active splitter mechanically samples the prep stream at a rate commensurate with the programmed split ratio. The sampled stream is then diluted and carried to the detectors by the makeup solvent. Active splitters often disturb the baseline, however, and, in addition, mechanical wear frequently compromises performance. Both passive and active flow splitters are equally effective at sampling the prep stream, so the type of splitter employed is dependent upon user preference.
Modifiers
Specific mobile-phases and modifiers are chosen based upon the intended use of the peptide being isolated. As discussed earlier, the mobile-phase modifier is an additive that controls the ionic character of the peptide by raising or lowering pH. It may also increase sample hydrophobicity by forming ion-pairs with the peptide’s charged side chains and end-termini. Trifluoroacetic acid is commonly used for this purpose. The ion-pairing increases the interaction of the peptide with the hydrophobic column stationary phase, and consequently, the quality of the separation usually improves. Unfortunately, the strong ion pairs formed with TFA cannot be broken apart easily with the conditions used in electrospray ionization. As a result, fewer peptide molecules are ionized and the signal intensity is reduced. Ideally, the most suitable modifier would be one that would form ion pairs to improve the chromatographic separation, yet not impede electrospray ionization.
Apffel, et al. proposed post-column addition of a weak acid which would compete with the TFA to pair with the analyte.31 With a weak acid at a concentration high enough to drive the competition to favor protonating the TFA, the protonated TFA can be evaporated and the analyte can ionize more efficiently. The sensitivity and intensity of the MS signal are increased.6 While many different acids in different concentrations can be used for this purpose, 0.1% propionic acid in 1:1 water/organic as the makeup solvent in mass-directed purification has been used with success.32
Monoisotopic Mass vs. Average Mass
While mass-directed purification reduces the ambiguity in the isolation of peptide targets, it is important to consider which masses should be used for fraction triggering. For most small molecule isolations, the monoisotopic mass is the main mass used for identification while other related ion adducts are defined and monitored based on this value. For larger molecules such as peptides, sometimes the average mass is used as the primary identifier.
The monoisotopic mass is calculated using the mass of the most abundant isotopes of each element in the molecule, while the average mass is calculated using the weighted average of all of the naturally occurring isotopes of each element in the molecule.33, 34, 35 Consequently, for peptides, the average mass can be notably larger than the monoisotopic mass. As the number of carbons in the molecule increases, there is a greater probability that more 13C will be present, which will, in turn, increase the molecular weight. In addition, the monoisotopic mass may not be the most abundant peak in the mass spectrum. While there is no rule to define when to use monoisotopic mass or average mass, the 1500-1700 molecular weight range is generally the crossover point for transitioning to using average mass for peptide triggering. In practice, many available software programs calculate both the average and the monoisotopic m/z for the peptide charge states. It is most prudent to include both alternatives as triggers. The best choices for triggering will become evident during the screening run prior to isolation.
Charge States
Electrospray, a technique which ionizes samples with mild conditions and generates molecules with multiple charges, is frequently used in mass-directed purification. Although some peptides may have molecular weights higher than the upper mass limit of the analyzer, multiply-charged ions with lower m/z values usually fall within the mass range of the spectrometer. Several factors influence the charge states of peptides including the solution pH, the number of acidic and basic functional groups, and the physical properties of the solvent used in the analysis.36
As previously discussed, the peptide isolation process usually starts with analysis. The molecular weight and the possible charge states are calculated, ensuring easier identification of the peptide product. While the crude sample profile reveals the extent of method development required for improving resolution that will lead to the isolation of pure product, the analysis also reveals information about charge states. Consider the mass spectrum derived from the crude analytical total ion chromatogram shown in Figure 49. The calculated peptide mass was 1772.9 and the positively charged ion (1773.9) is present, albeit in a very small amount. The doubly-charged ion at 887.8, is, by far, the ion present in greatest abundance. A small amount of triply-charged ion (592.3) and an impurity (781.2) are also present in lesser quantities. Despite the presence of multiply-charged ions in the mass spectrum, the peptide is revealed as a single peak in the chromatogram. Doubly and triply-charged peaks predictably elute at the same time in the extracted ion chromatograms (Figure 50).
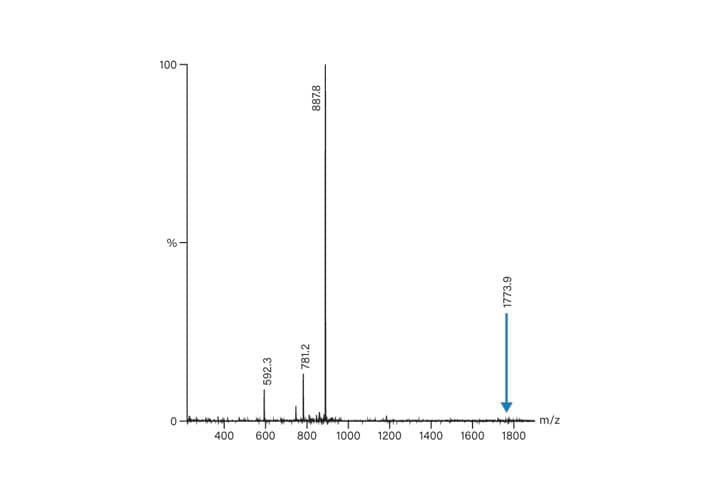
Figure 49: Spectrum derived from the crude analytical TIC.
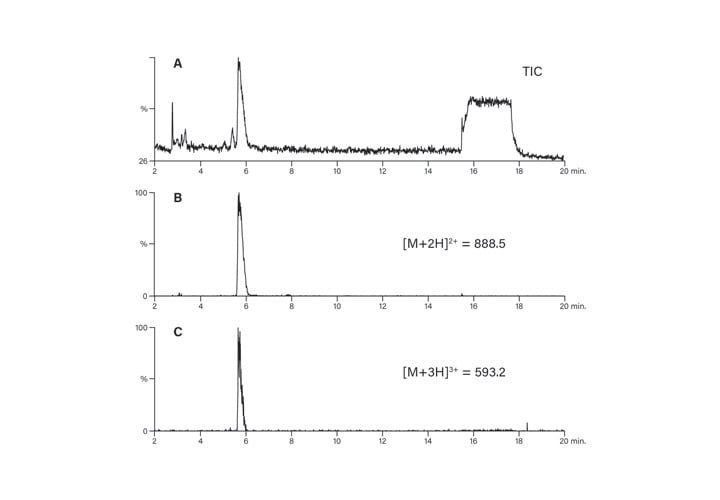
Figure 50: Elution of multiply-charged peptide ions.
Fraction Collection Triggers
Multiple charging of peptides often makes it difficult to predict the most abundant species in a given MS experiment. Therefore, fraction triggers for peptide isolation using mass-directed purification must include all of the expected multiply-charged ions.
Data Collection: Continuum vs. Centroid
Because of the complexity of peptide samples, the probability of multiple charge states, and the alternatives for using either monoisotopic or average mass as the peptide increases in length, MS data should be collected in continuum mode. Continuum data shows the observed intensity of all resolved points on the mass axis. It includes the statistical imprecision in measuring the m/z of a particular intensity. This raw signal can then be processed to yield the intensity of each the possible overlapping mass signals3. 7 This allows for the discrimination of closley similar m/z’s. Centroid data is continuum data processed to display a single, centered data point for each distribution of ions in a mass spectrum and are displayed as sticks in the mass spectrum (Figure 51).
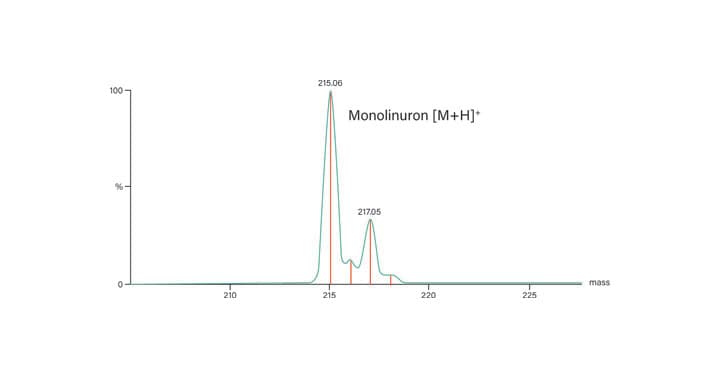
Figure 51: Overlay of continuum and centroid mass data.
Mass-Directed Peptide Isolation Examples
The following two peptides, provided by Dr. Kelly Wasmund of Research Genetics, Inc. (Huntsville, AL, U.S.), were isolated by mass-directed purification using the principles discussed:
■NH2-ISQAVHAAHAEINEAGR-COOH (abbreviated as ISQA)
■NH2-SIINFEKL-COOH (abbreviated as SIIN)
Each peptide was individually wetted in 0.5 mL dimethylformamide (DMF) and then diluted to 5.0 mL with water. The concentration of ISQA was estimated at 5-10 mg/mL and SIIN was estimated at 10 mg/mL. The conditions for the small scale separations of each of the peptides are given in Table 7; the chromatographic and spectral results are presented in Figures 52 and 53, respectively. The calculated target ions for the various charge states of ISQA and SIIN are shown in Table 8.
Small Scale
Solvent A: 0.1% TFA in water
Solvent B: 0.1% TFA in acetonitrile
Injection vol.: 40 µL
Column: 4.6 × 50 mm Symmetry® 300, C18, 5 µm
Large Scale
Solvent A: 0.1% TFA in water Solvent B: 0.1% TFA in acetonitrile
Injection vol.: 5 mL
Column: 30 × 150 mm Symmetry 300, C18, 7 µm
Target masses: (ISQA) [M+H]+ = 1773.9, [M+2H]2+ = 887.5, [M+3H]3+ = 592.2, [M+4H]4+ = 447.2
Target masses: (SIIN) [M+H]+ = 963.5, [M+2H]2+ = 482.3, [M+3H]3+ = 321.9
|
Time (min)
|
Flow Rate (mL/min)
|
%A
|
%B
|
|
0.00
|
1.35
|
95
|
5
|
|
20.00
|
1.35
|
20
|
80
|
|
21.00
|
1.35
|
0
|
100
|
|
24.00
|
1.35
|
0
|
100
|
|
25.00
|
1.35
|
95
|
5
|
|
30.00
|
1.35
|
95
|
5
|
Table 7: Gradient conditions used in the small scale separations of ISQA and SIIN.
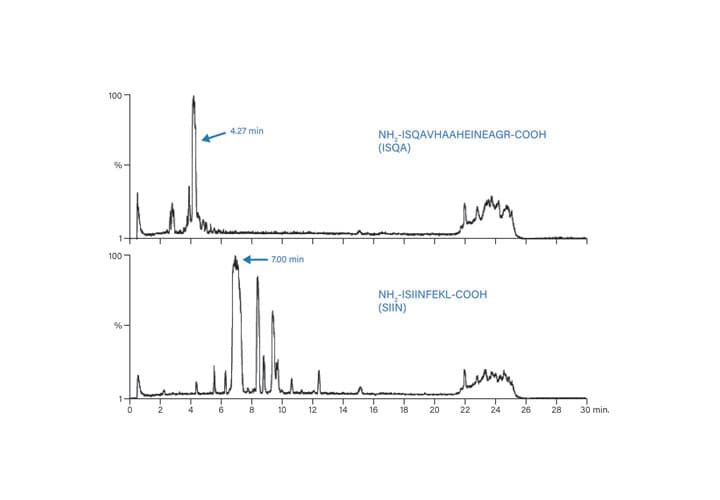
Figure 52: Total ion chromatograms for the small scale separations of ISQA and SIIN.
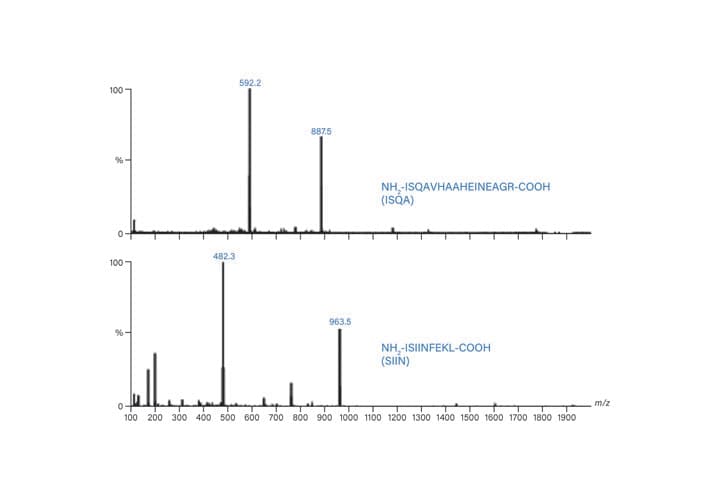
Figure 53: Mass spectra for ISQA and SIIN.
|
NH2-ISQAVHAAHAEINEAGR-COOH (ISQA)
|
|
Monoisotopic Mass
|
1772.9 Da
|
|
Target Ions for Charge States
|
m/z
|
|
[M+H]+
|
1773.9
|
|
[M+2H]2+
|
887.5
|
|
[M+3H]3+
|
592.2
|
|
[M+4H]4+
|
447.2
|
|
NH2-SIINFEKL-COOH (SIIN)
|
|
Monoisotopic Mass
|
962.5 Da
|
|
Target Ions for Charge States
|
m/z
|
|
[M+H]+
|
963.3
|
|
[M+2H]2+
|
482.3
|
|
[M+3H]3+
|
321.9
|
Table 8: Calculated target ions for the various charge states of ISQA and SIIN.
Focused gradients for each of the peptides were designed to improve the resolution between the target peptide and its closely-eluting contaminants. The preparative focused gradient for ISQA started at 12%B and ran to 20%B, with the peptide eluting near 17%B (Table 9 and Figure 54). Similarly, the preparative focused gradient for SIIN ran from 23%-31%B, with product eluting near 28%B (Table 10 and Figure 55). The mass triggers for fraction collection included the expected multiply-charged ions (Table 8).
|
Time (min)
|
Flow Rate (mL/min)
|
%A
|
%B
|
|
0.00
|
57.50
|
95
|
5
|
|
2.00
|
57.50
|
95
|
5
|
|
3.00
|
57.50
|
88.4
|
11.6
|
|
36.50
|
57.50
|
80.4
|
19.6
|
|
37.50
|
57.50
|
20
|
80
|
|
39.50
|
57.50
|
20
|
80
|
|
40.00
|
57.50
|
95
|
5
|
|
55.00
|
57.50
|
95
|
5
|
Table 9: Focused prep gradient used for the purification of ISQA.
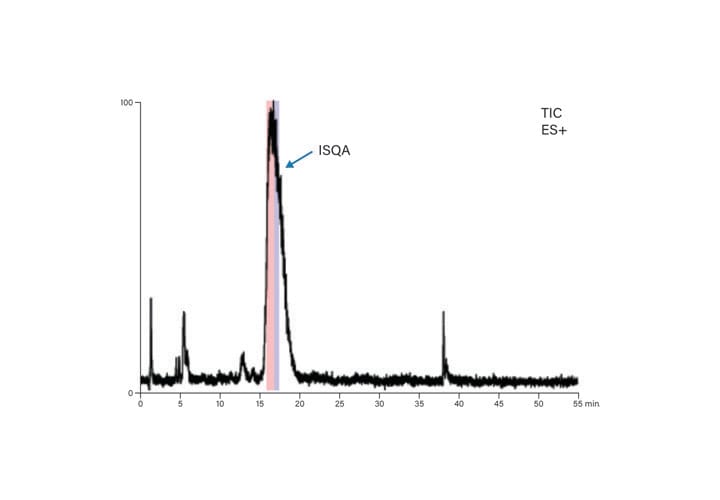
Figure 54: Preparative MS chromatogram for ISQA.
|
Time (min)
|
Flow Rate (mL/min)
|
%A
|
%B
|
|
0.00
|
57.50
|
95
|
5
|
|
2.00
|
57.50
|
95
|
5
|
|
3.00
|
57.50
|
77.1
|
22.9
|
|
36.50
|
57.50
|
69.1
|
30.9
|
|
37.50
|
57.50
|
20
|
80
|
|
39.50
|
57.50
|
20
|
80
|
|
40.00
|
57.50
|
95
|
5
|
|
55.00
|
57.50
|
95
|
5
|
Table 10: Focused prep gradient used for the purification of SIIN.
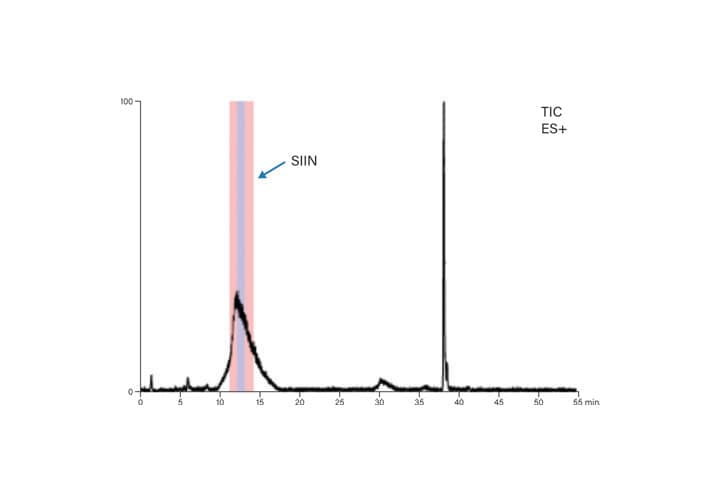
Figure 55: Preparative MS chromatogram for SIIN.
The fractions resulting from the preparative runs were analyzed to assess purity. Multiple detection channels were used to monitor the analysis to provide complete characterization of the fractions. The fraction analysis of both ISQA and SIIN peptides were run with the same gradient method used for the crude peptide analysis. The results are shown for ISQA and SIIN in Figures 56 and 57, respectively.
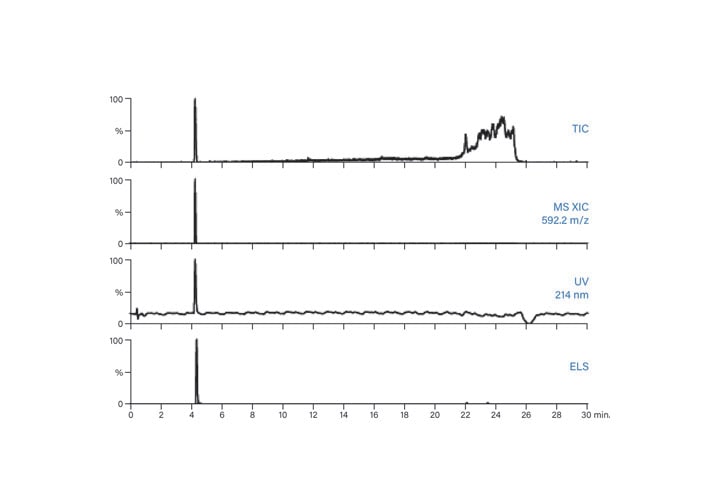
Figure 56: Fraction analysis of ISQA.
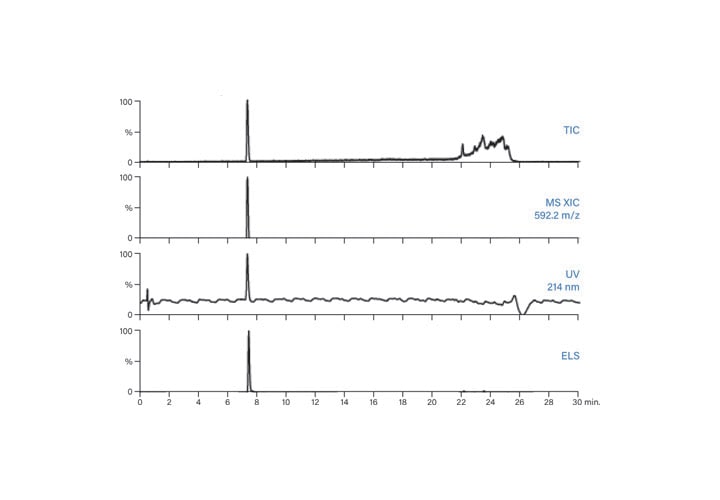
Figure 57: Fraction analysis of SIIN.
CONCLUSION
Peptides continue to fill an important niche in the field of therapeutics with new and improved technologies for synthesis, drug design, discovery and development, and manufacturing3. 8 Despite changes in technology, the fundamentals of peptide isolation remain constant with many processes relying on reversed-phase HPLC coupled with UV and mass detection. Analyzing the crude peptide using a fast gradient, focusing the gradient and scaling geometrically to a larger column with At-Column Dilution and temperature control are effective means for rapidly isolating target peptides. Although UV detection is widely used in peptide isolation, mass-directed purification reduces the number of collected fractions and the time required for subsequent fraction analysis. Managing the detector signal by using split and dilute technology, using suitable chromatographic mobile-phases, modifiers, and make-up solvents, and selecting reasonable charge states for fraction triggering simplify the peptide purification protocol.