GPC Basic Chemistry
GPC/SEC Separations - Theory and System Considerations
- Introduction to size separation
- Monomers, oligomers, polymers and molecular weight distributions
- Molecular weight averages, Mn, Mw, Mz, Mz+1
Configuring a GPC System:
- Solvent management
- Sample management
- Column selection
- Detector options
- Data handling
Calibration of the GPC System
- Relative, Narrow Standard Calibration
- Broad Standard Calibration
- Universal Calibration
Performing a GPC Analysis
- Solvent Selection
- Solvent Selection Guide for Room Temp. Organic Soluble Polymers
- Solvent Selection Guide for Elevated Temperature Organic Soluble Polymers
- Discussion of Organic Solvents for GPC
- Solvent Selection Guide for Water Soluble Polymers with Methacrylate Gel Column Packings
- Concentration
- Preparing the Sample
GPC/SEC Separations - Theory and System Considerations
Introduction to size separation:
Gel Permeation Chromatography, (GPC), also known as Size Exclusion Chromatography, (SEC) is really the easiest to understand of all the liquid chromatographic techniques. The separation is based strictly on the size of the sample in solution, and there should be no interaction with the column packing, (adsorption, partition, etc.), as you have with conventional HPLC. The mode of separation is not based on molecular weight, but on the size of the material being analyzed (usually a polymer) in solution. In other words, to do GPC correctly, the sample must be dissolved in a suitable solvent.
The concentration of the sample in solution depends on the molecular weight, but a concentration of 0.10% (w/v) for a polymer of molecular weight ~100,000, is typical. (See more in the Sample Prep. Section below). At times, the sample solution must be heated to dissolve the sample. For example, some polyolefins need temperatures greater than 120° C to dissolve, and are typically run in 1,2,4 trichlorobenzene at 140° C.
Once the sample has been suitably dissolved, it is introduced via an injection mechanism onto a set of columns which act as a molecular filtration system. The columns are packed with a crosslinked gel, (styrene/divinylbenzene copolymer for organic applications, for example), which contain surface pores. These pores can vary from small to quite large, and act as the molecular filters mentioned above.The larger size molecules will not fit into the smaller pores. Conversely, the smaller molecules will fit into most of the pores, and be retained longer.
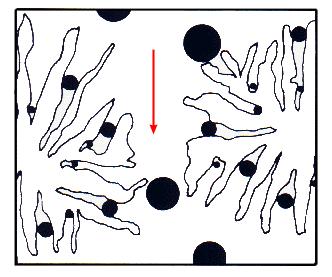
The larger molecules will elute first according to BOCOF's law (Big Ones Come Out First).
One of the first GPC demonstrations performed by Waters decades ago was on chewing gum. Chewing gum is really synthetic rubber, plus additives such as flavors, stabilizers, etc.
Here is a representation of the original GPC chromatogram,separated on several columns of various pore sizes connected in series. The polymer (rubber in this case) elutes first because it is the largest molecule, followed by the "additives" in decreasing order of size. This could just as well be a chromatogram of PVC with a mixture of plasticizers, antioxidants and UV stabilizers.
Monomers, Oligomers, Polymers and Molecular Weight Distributions
Monomers have a single molecular weight, and are said to be monodisperse. Examples would be ethylene, styrene, vinyl chloride, etc. After monomers, we have dimers, trimers, tetramers, pentamers, etc., which are called oligomers. As we get to higher molecular weights, the group is called polymers. Polymers have a distribution of chain lengths, and, therefore, molecular weights. Depending on how the polymerization was carried out, this distribution can be narrow, or quite broad. As an example, a condensation, or step-growth polymer, such as a polyester, (polyethyleneterephthalate), will have a fairly narrow distribution of molecular weights. On the other hand, a free radical polymerization may produce a polymer with a very broad distribution of chain lengths and molecular weights, (such as for polyolefins). Controlling the kinetics of the polymerization is extremely important in obtaining a desired molecular weight distribution.That is why GPC is such an important technique to the polymer chemist.
Here we show an an overlay of two molecular weight distributions of a polymer (in this case polystyrene):

Molecular Weight Averages, Mn, Mw, Mz, Mz+1.
Once we obtain the molecular weight distribution of the polymer sample, we need a way to quantify it. We assign molecular weight averages across this distribution by simply doing statistics. There is a height, (Hi, also represented as concentration, Ci) a retention time, and a molecular weight, (Mi), attributed to each slice. The molecular weight is obtained from a calibration curve (see next section). We next perform a summation to obtain the various molecular weight averages that describe the polymer molecular weight distribution. The PD shown is the ratio of the weight average and number average molecular weights and is called the polydispersity, or sometimes simply, the dispersity of the polymer. This summation is just a simple way to obtain these four molecular weight statistical moments and describe the molecular weight distribution.
There are other techniques to obtain these molecular weight averages:
- Number average, Mn, may be obtained by membrane osmometry, or end group analysis, (titration, NMR, etc.)
- Weight Average, Mw, may be obtained by light scattering
- Z Average, Mz, and Z + 1 Average, Mz + 1, may be obtained by ultracentrifugation
Once we have calibrated our GPC system, we can obtain all of these averages with a single injection.
Configuring a GPC System
Now that we have an understanding as to what molecular weight averages are all about, we are ready to put a system together.

The system (shown above) consists of a pump, an injector of some sort, either manual or automated, the column set, the detector(s), and some sort of data handling device. In addition, it is a good idea to use a degasser, particularly when using THF with a refractive index detector. The columns are almost always heated to some elevated temperature, even for room temperature soluble applications to insure low pressure drop and uniform viscosites. We will now discuss the system in more detail.
Solvent Management
The pumps that are being used today with Waters GPC systems are really sophisticated fluid handling devices. In the case of the fluidics system being used in the Alliance system, it is really a solvent manager. The single most important thing to consider in choosing a fluidics module for GPC analysis is the flow precision. The calibration of the system is a plot of retention time (or volume) vs. the log of the molecular weight. Any minor flow fluctuation will result in a potentially large error in molecular weight. It is to your advantage to use the most precise fluid-handling device you can. This will improve the precision of your molecular weight average measurements immensely over some of the low flow precision traditional pumps that are still being used. With the solvent manager that is used with the Alliance system, the flow precision is remarkably under 0.075% without any flow rate correction! Some pumps in the marketplace claim similar flow precision but with software flow rate correction. Be wary of pumps in the marketplace that list a specification of 0.3% (and worse) if you are putting a GPC system together.
The Alliance system solvent manager also provides exceptional gradient and flow program performance. Many polymer characterization chemists are realizing how important it is to analyze the additive package, in addition to determining the molecular weight distribution of the polymer. In many cases, the additive package has as much to do with the successful application of a finished product as the polymer used to fabricate the product. Any errors in the compounding (incorrect antioxidant, or incorrect level of plasticizer, for example) of the additives into the main formulation may result in unacceptable physical properties and performance. In order to successfully characterize the additive package, a reverse-phase gradient HPLC analysis is performed. In addition to polymer additives, epoxy and phenolic resins are regularly analyzed by both GPC (to examine the oligomer distribution) and gradient HPLC (to characterize the isomer and impurities). The Alliance system allows you to do both high performance GPC and gradient analysis with a single system.
Sample Management
The next step in configuring our system is to decide how we wish to introduce the standards and samples for the separation. The least expensive way to do this is with a manual injector. You manually fill a loop (known volume) and open a valve to let the solution flow onto the column set with the eluent stream. This is fine if you happen to be running just a few samples now and then. However, if you are running several samples each day, it may be better to consider an autosampler.
The autosampler used most today for room temperature GPC analysis is the 2707 Autosampler. This all-electric autosampler will allow you to set up a full tray of samples to run unattended for as long as the analyses take. The injection volume accuracy and reproducibility is unsurpassed, which is critical for molecular weight sensitive detector mass measurements, (such as with a viscometer or light scattering detector), where the exact mass loading must be known. Another option for an autosampler is the Alliance system. There are five different carousels, each holding up to 24 samples (120 total sample capacity).
Column Selection
Once we have found a suitable solvent to dissolve the polymer, and prepared our narrow standards and samples at the correct concentration, we are ready to start our analysis. We have chosen the correct column set to do the analysis (or have we?), so we are ready to go. However, let's review the procedure to choose the correct column set.
Many people like to use what used to be called "Linear" columns, which are also called "Extended Range" or "Mixed Bed" columns. These columns are blends of different pore sizes, the idea being to cover a broader molecular weight range than a column with a single pore size. If the blending of pores is done carefully enough, the column calibration curve may indeed be linear.
The drawback in using these mixed bed columns is that you will have less resolution over a finite molecular range than if you used individual pore size columns. For example, if you were running a series of epoxy or phenolic resins, say with a molecular weight range of a few hundred to five thousand, what column set would you use? The first consideration is to have enough pore volume in the column set to obtain the correct separation, i.e. the correct distribution profile of the polymer. One column is certainly not enough, and two may still not be enough. One should use at least three columns in series to guarantee that we have enough pore volume to ensure a successful separation.
Now, what columns will we use to analyze our epoxy or phenolic resin? Should we use a "mixed bed" column set, with a mixture of pore sizes? Or should we use a series of individual pore size columns to really target the molecular weight range of interest? The following table lists the molecular weight range of separation for individual pore size columns of styrene/divinylbenzene packings, based on polystyrene chain length exclusion limits (in Angstroms):
| Molecular weight range |
Pore size |
| 100 - 1000 |
50 A |
| 250 - 2500 |
100 A |
| 1,000 - 18,000 |
500 A |
| 5,000 - 40,000 |
103 A |
| 10,000 - 200,000 |
104 A |
| 50,000 - 1,000,000 |
105 A |
| 200,000 - > 5,000,000 |
106 A |
| 500,000 - ~20,000,000 |
107 A |
| ~1,000 - 10,000,000 |
Mixed Bed - High |
| ~100 - 100,000 |
Mixed Bed - Low |
Just one more word about columns. If you looked through the GPC solvent guide, you noticed that a typical operating range of temperatures were shown. In GPC analysis, we almost always heat the columns to some elevated temperature as shown in the solvent guide, (even for room temperature applications). The purpose of heating the columns is not for dissolution purposes, but to increase the resolution of the separation, enhance the permeation process, and in some cases, to decrease the viscosity of the solvent (DMF, for example), and reduce backpressure across the column bank.
Detector Options
The most widely used detector today for GPC analysis is the differential refractometer. It is a concentration sensitive detector that simply measures the difference in refractive index (dRI) between the eluent in the reference side, and the sample + eluent in the sample side. It is a "universal" detector (unlike an UV detector, for example) in that you will get a response for any polymer that has a significant difference in refractive index as compared to the eluent. In some cases, the d RI for the sample and eluent (silicones and THF, for example) is very small, resulting in a poor signal. In that case, we need to find another eluent that will dissolve the polymer and provide a significant d RI. The Waters 2414 refractometer (and previous Model 2410 and 410) have been the industry standard for many years.
Another detector that is used often for GPC is the UV detector. Obviously, we need to have some chromophore present that will absorb in the UV to get a signal. The UV detector is excellent for styrenic type polymers, (polystyrene, styrene/isoprene, styrene/butadiene, ABS, etc.), epoxies, phenolics, polycarbonates, polyurethanes, and aromatic polyesters, for example. If gradient analysis is being performed, (solvent composition being changed throughout the run) the UV detector must be used, since the RI detector would continue to drift as the eluent composition changes. Waters 2489 UV Detector provides excellent sensitivity, linearity, and overall outstanding performance for GPC/HPLC analysis of UV absorbing polymers and additives.
We can also use a photodiode array (PDA) detector, which is a step up from the UV, and is a powerful, information-rich detector. An array of photodiodes is used in this detector, where we can look at a wide variety of wavelengths instantaneously. For example, we could set the PDA to look at a wavelength range from 190 to 800 nanometers (nm), instead of looking at just one or two wavelengths as for most UV detectors. Now we can look at the actual UV spectra for the polymer sample (or additives). This allows us to determine something about the chemical composition distribution. We can determine if an SBR (styrene/butadiene rubber) is a block or random copolymer, for example. We can create spectral libraries, which we can compare our unknown samples with. This can be done for polymers or with polymer additives. We can now try to identify which additives are present in compounded, finished materials. The PDA can be used to help deformulate competitive compounds as well.
As polymer characterization chemists strive to learn as much as they can about their samples, other detection options are considered. As we move into the world of "advanced" detection for GPC analysis, we begin to consider the molecular weight sensitive detectors such as viscometry and light scattering. The viscometer detector will be discussed in some detail in the calibration section that follows. Essentially, putting a viscometer detector in line with the refractometer provides a way to obtain not only the intrinsic viscosity [h] of the polymer, but also the "absolute" molecular weight and estimation of long chain branching. The RI detector is our concentration detector, (C), and the viscometer provides us with [h](C). Using the two signals in tandem will provide us with the intrinsic viscosity at each slice across the elution profile of the polymer. We can then use Benoit's Universal Calibration concepts discussed in the next section to obtain the absolute molecular weight of the polymer sample.
The light scattering detector, coupled with the refractometer, is another powerful mode of advanced detection for GPC analysis. Essentially, a laser beam is focused into a cell (on-line in this case) that contains the sample solution. The incident beam will be scattered by the polymer particles that are in solution. Depending on the design of light scattering detector (small angle or multi-angle), the weight average molecular weight, Mw, can be measured accurately with or without the radius of gyration result of polymer in solution.
In both cases of the viscometer and the light scattering detector in tandem with the RI, we obtain a lot of very useful information. Using a triple detector approach provides very meaningful data, as long as the user is able to interpret it all. For a more detailed discussion on multi-detector data reduction, please refer to our reference section.
There are other techniques for advanced detection of polymers and additives, such as Mass Spec, but the common detectors used today for GPC analysis are the RI, UV/PDA, Viscometer and Light Scattering.
Data Handling
Once we have configured the main hardware portion of our system, we must now consider the software options for control of this system and processing the data. With today's very powerful computers, calibration and molecular weight distribution calculations may be done in seconds. Empower Software may be used for both conventional GPC (RI only) data reduction, as well as for RI/Viscometry detection. Empower 2 supports many calibration procedures, including Relative Calibration, Cumulative Matching and Hamielec Broad Standard Calibration, and Universal Calibration. Zero through fifth order curve fits, along with a unique Bounded Calibration, and a splines fit, are all supported. See the Empower link for more detailed information.