SAMPLE INTRODUCTION
Sample injection can be accomplished manually for low throughput, or injection can be automated for high throughput applications. In manual injection, a Rheodyne valve fitted with an injection loop is removed from the flow path by rotating a valve handle. A filtered sample is drawn into a syringe, a blunt needle tip is attached and the air bubbles removed. The needle is inserted into the sample injection port and the sample is dispensed into the injection loop. The Rheodyne valve handle is rotated to put the injection loop back into the flow path. In this position the sample is placed into the flowpath.
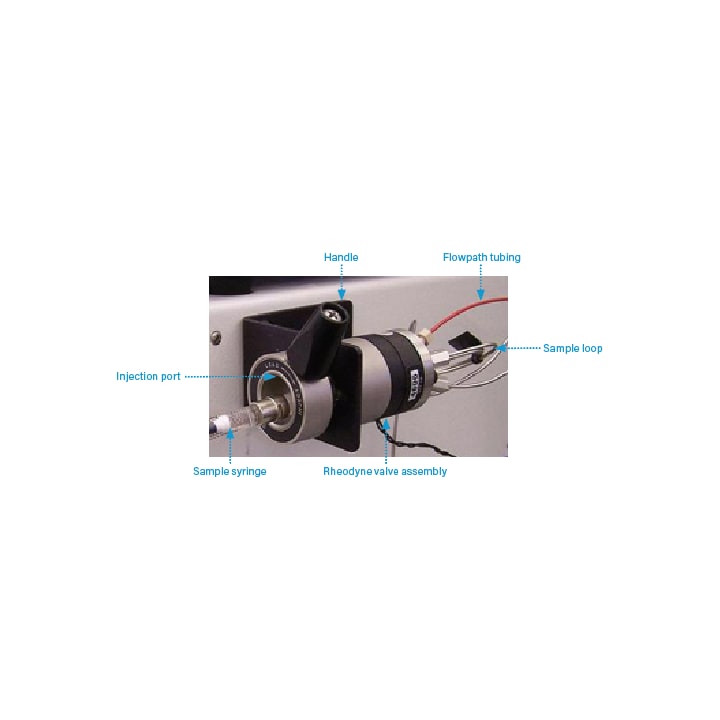
Figure 33: Manual Rheodyne injection valve components.
Sample injection can also be automated for high throughput. High capacity autosamplers can manage sample aspiration and injection on a single platform. A robotic arm is configured in the purification software in order to control the injection of samples from microtiter plates, test tubes, scintillation vials or conventional autosampler vials.
INJECTION LOOPS
Typically, an injection loop is selected based upon the size of the intended injection volume. When the volume of the loop is too large, the sample may absorb to the excess surface area of the loop causing a delay, or sample dispersion can occur, both of which can adversely affect the quality of the chromatography. A loop size close to the intended injection volume provides the best reproducibility and chromatographic profile.
FRACTION COLLECTORS
The desired throughput for the application determines the level of automation necessary for fraction collection. A fraction collector consists of a switch and sample diverter valve. The diverter valve is opened at the appropriate time to allow compounds to be collected as they elute.
While fraction collection can be performed manually for low throughput applications, it can also be automated for higher throughput. The level of automation is determined by the number and volume of fractions that are desired. High throughput fraction collectors often combine sample injection and fraction collection on the same worktable using a robotic arm fitted with sampling and fraction collection probes.
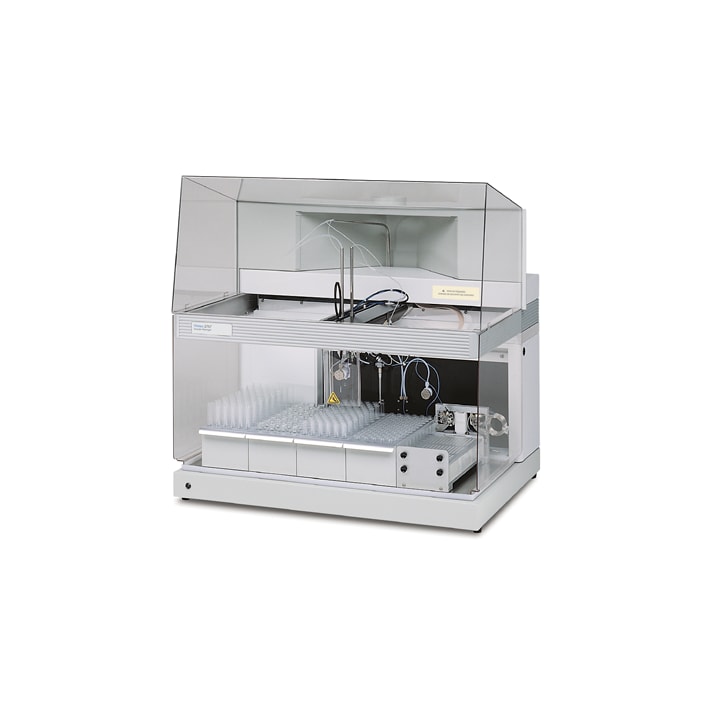
Figure 34: Waters 2767 sample manager and fraction collector with optional fume hood for ventilation.
COLLECTION VESSELS
Many purification systems can accommodate a wide range of collection vessel shapes, sizes and volumes. The most common collection vessels include test tubes, vials, bottles or funnels which dispense into large vessels. Collection vessels need to be clean, dry and inert when exposed to the sample and solvent. They are typically placed in the vessel collection bed without a top closure to accommodate dispensing of the isolate.
With some collection systems, fractions that are not collected do not go to waste, but can go into a sample specific waste container. If the user collects the incorrect peak, runs an inappropriate method, fails to detect the target, or collection fails to trigger, it will flow into a special waste container from which the solvent can be evaporated, the sample re-dissolved and re-injected.
DETECTORS
Special considerations must be given to detection when performing purification chromatography. The four main detector types used for purification are UV/Vis, Refractive Index (RI), Evaporative Light Scattering (ELS) and Mass Spectrometry (MS).
Detectors may detect at a single wavelength that can be set by the user (UV/Vis), or absorbance over a wavelength range can be collected by a photodiode array (PDA) detector. The PDA is often utilized during method development to select a suitable wavelength for the compound of interest. This is accomplished by collecting wavelengths between 200–400 nm or higher (≥350 nm) when working in the visible range. The wavelength that provides the maximum signal intensity for the compound of interest is the optimum wavelength for the isolation. The optimum wavelength for close eluting impurities should also be determined. Otherwise a “pure isolate” collected at one wavelength may actually contain impurities when observed at a different wavelength. When this occurs, a secondary method development and purification may be required to further purify the isolate.
When using UV/Vis and PDA detectors, high sensitivity can be a hindrance for large injection volumes and high sample concentrations common during purification. As a result, detector flow cells with short pathlengths (1–3 mm) are employed rather than analytical flow cells with long pathlengths (10 mm).
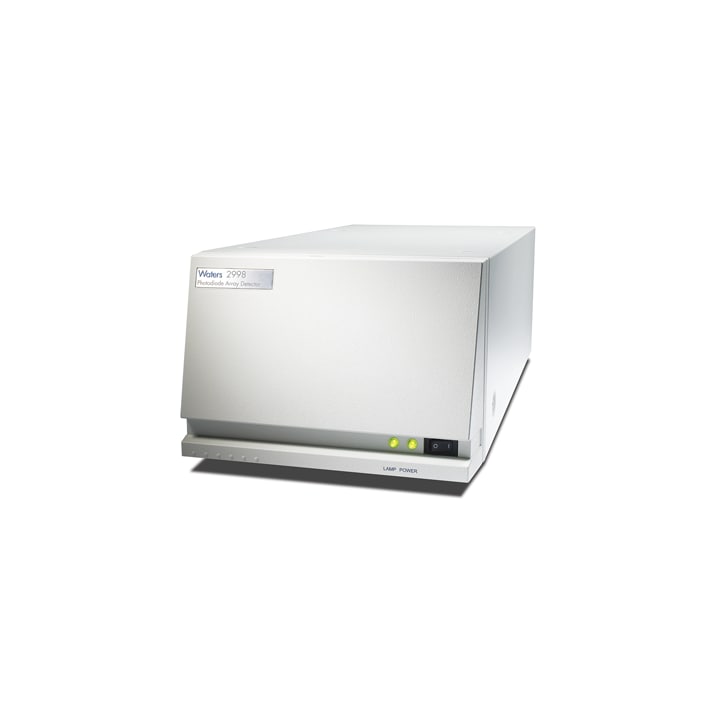
Figure 35: The 2998 Photodiode Array (PDA) Detector.
RI detectors have some advantage for detection of components with limited or no UV absorption, such as alcohols, sugars, saccharides, fatty acids, and polymers. The RI detector detects differences in refractive index to determine the presence or absence of a compound. The RI detector is sometimes called a “universal” detector because it is not reliant on the compound ionizing or containing a chromaphore. A disadvantage of the RI detector is that it can only be used in isocratic separations, in order to avoid detection of gradient disturbances that cause baseline drift.
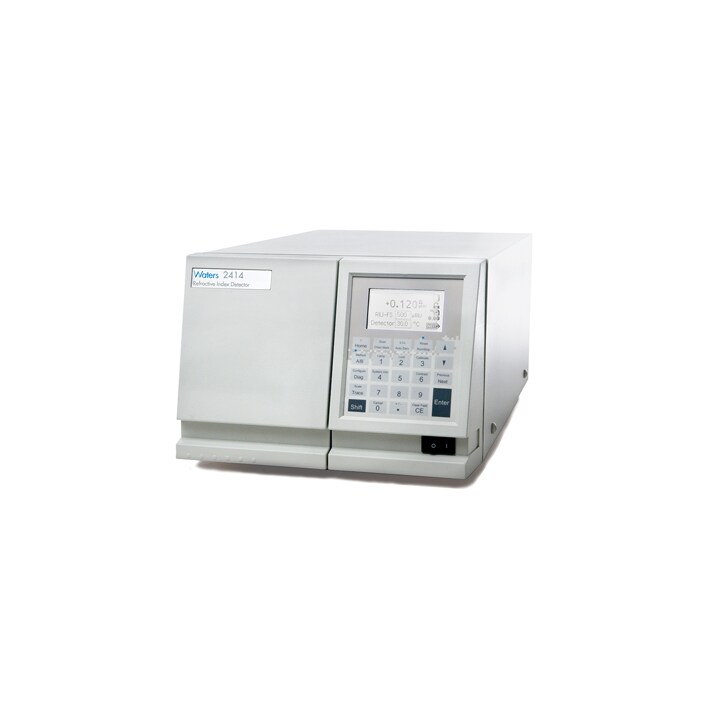
Figure 36: Waters®2414 Refractive Index (RI) Detector.
ELS detectors can be used as an alternative to UV/Vis and RI detectors. ELS detectors work by passing the eluate through a heated nebulizer to volatilize the analyte and evaporate the solvent. The solvent is carried away as a gas but the analyte forms a stream of fine particles, which passes between a light source and a detector that scatters light and measures the effect. The main advantages of ELS detectors are that they will detect compounds not possessing a chromaphore and can be used in both isocratic and gradient separations. A disadvantage is that ELS detectors are sample destructive, therefore the detector cannot be put in-line with the main flow path. The flow path must be split so that a small proportion goes to the ELS detector and the rest goes to the fraction collector.
MS detectors identify the separated sample compounds emerging from the column on the basis of their mass and the mass spectrometer. MS is one of the most sensitive and highly selective methods of molecular analysis, and provides information on the molecular weight as well as the fragmentation pattern of the analyte molecule, invaluable for confirming analyte identity. Various types of MS systems incorporating different types of interfaces are available. The most popular interfaces are electrospray (ESI) and atmospheric pressure chemical ionization (APCI). Each interface is associated with different fields of applicability, flow rate capability, sensitivity and response linearity. As with ELS detectors, MS is a destructive technique therefore the flow must be split so that a small portion goes into the detector and the main portion goes to the fraction collector.
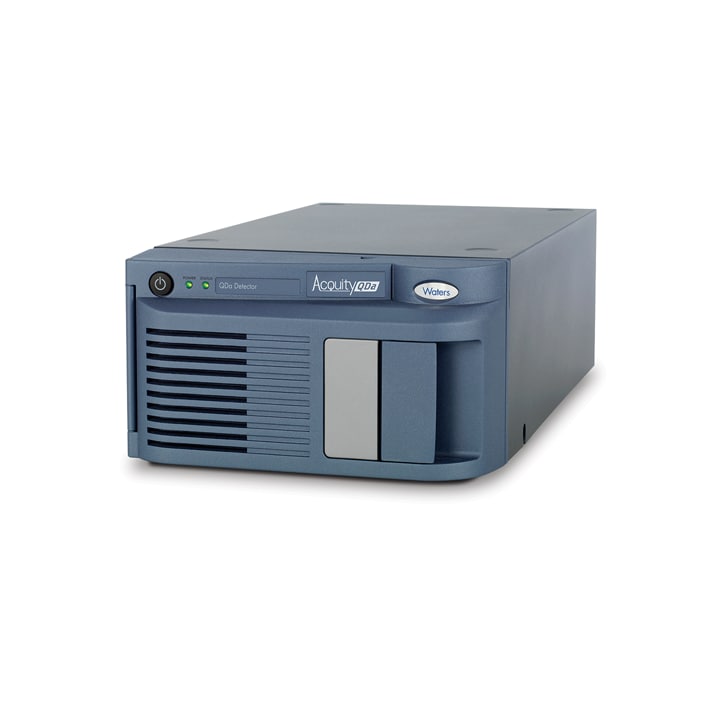
Figure 38: Waters ACQUITY QDa Detector.
FLOW SPLITTERS
For chemically destructive detectors such as in MS or ELS, a portion of the flow coming from the column must be split from the main flow stream to go to the detector for fraction triggering. Since the detectors must detect a peak before the fraction collector is triggered (delay time), the split flow must arrive at the detector before the main flow stream arrives at the fraction collector. To accomplish this, the split flow velocity is increased by using a “make-up pump” and “make-up solvent.”
Flow splitters can be either “passive” or “active”. Both passive and active flow splitters are equally effective at sampling the main sample flow hence the type of splitter employed is dependent upon user preference.
Passive splitters involve the use of restrictive tubing such as a delay coil and “T fittings” to maintain a specific flow rate range and split ratio.
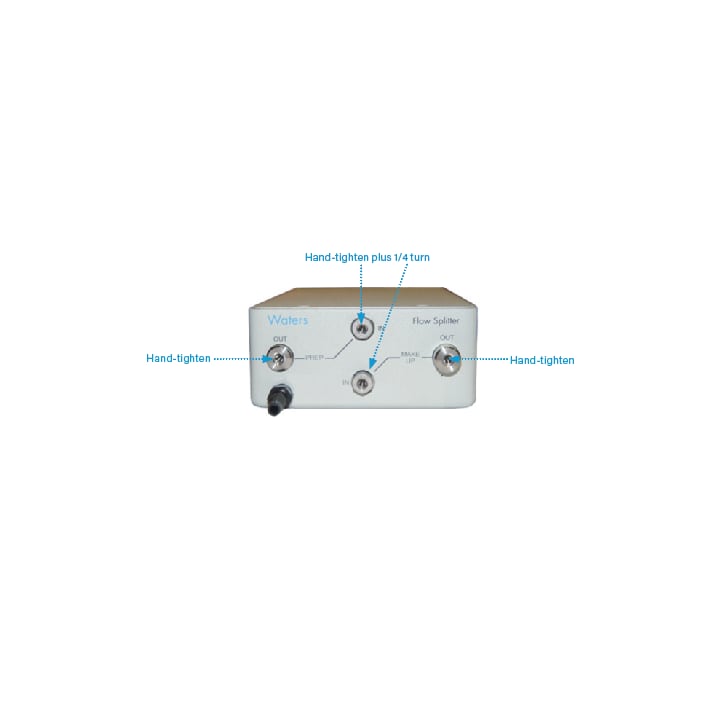
Figure 39: Passive splitter box.
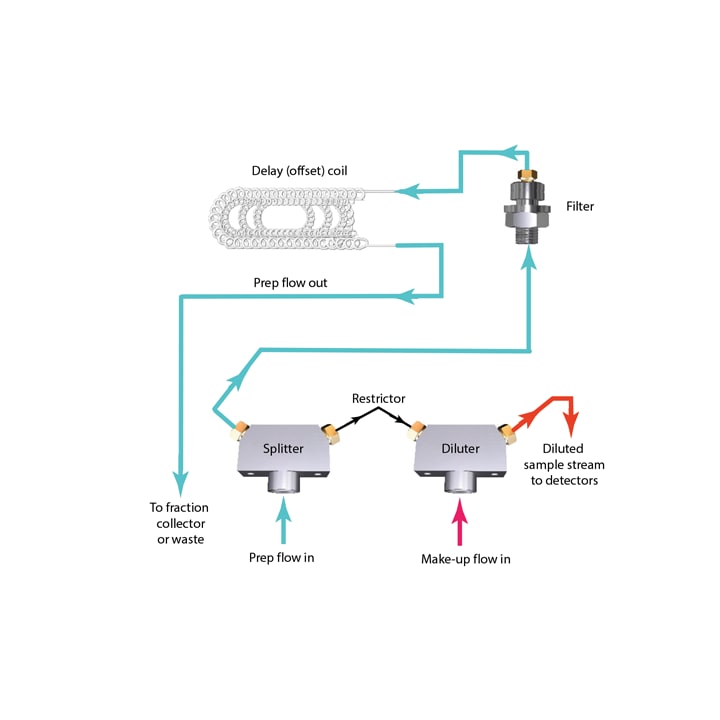
Figure 40: Flow diagram for passive splitter box.
|
Splitter part number
|
Flow rate range (mL/min)
|
Split ratio
|
Target column
|
|
205000435
|
0.5–2.0
|
15:1
|
4 mm
|
|
205000436
|
2.0–8.0
|
100:1
|
10 mm
|
|
205000437
|
8.0–30
|
1,000:1
|
19 mm
|
|
205000438
|
8.0–30
|
5,000:1
|
19 mm
|
|
205000439
|
30–100
|
5,000:1
|
30 mm
|
|
205000440
|
100–150
|
10,000:1
|
50 mm
|
Table 6: Passive splitter options available from Waters.
An active flow splitter has two completely separated flow paths and a rapid switching valve that transfers a portion of the main flow stream into the make-up flow where it is diluted at a programmed split ratio.
TUBING
When deciding on the appropriate tubing to use for the fluid pathway, there are several considerations that must be made. First, ensuring the integrity of the system’s flow path tubing largely depends on the suitability of the material from which the tubing is made and the application. Tubing can be either made from PEEK (polyether ether ketone) high-performance engineered polymer or stainless steel, and should be chemically compatible with the sample and mobile phase to prevent sample sticking to the surface of tubing, causing loss of sample, low yield or carryover.
The system tubing should also be able to withstand the pressures and operating temperatures of the flow path, although with purification chromatography, temperature control of the fluid pathway is often not used and therefore not a significant issue.
When considering pressure limitations, chromatographic purification systems can be separated into three zones – the “low pressure” zone between the solvent reservoir and the pump; the “high pressure” zone between the pump and the inlet of the column; and a second “low pressure” zone between the outlet of the column and the waste reservoir or fraction collector after the detector. The tubing in each zone has unique pressure holding requirements. Selecting an improper tubing material in a pressure zone that has critical requirements can lead not only to poor performance and chromatographic problems but also leaks and ruptures.
Two variables must be considered; the inner tubing diameter and the tubing length. Generally, the smaller the inner diameter the faster the inner velocity and the smaller the sample dispersion, allowing the sample to remain as concentrated as possible. However, as inner tubing diameter decreases, the pressure created by the tubing can increase significantly, potentially resulting in a system backpressure incompatible with the detector flow cell or other system components. When lengths of tubing with different internal diameters are connected, dead volume can form at or near the junction. This dead volume can cause peak shape issues and carryover as the volumes are not adequately swept by the fluid or mobile phase.
When considering tubing length, the more flow path volume that is being produced, the greater the opportunity for the sample to become diluted in the mobile phase, and for separated components merge back together. Tubing length can also contribute tomsystem pressures, delay volumes and extra column volumes. To prevent these issues the tubing length
Large scale prep purification systems generally operate at high flow rates.nTo moderate back pressure caused by these flow rates, it is important to plumb the purification system with tubing of appropriate diameter to ensure high quality chromatographic results. A range of tubing diameters are offered for flow rates of 0.05 mL/min to 130 mL/min.
|
Inside diameter
|
Color
|
Flow rate (mL/min)
|
µL/ft
|
Pressure limit (psi)
|
Pressure limit (bar)
|
|
0.0025"
|
Natural
|
0.05–0.2
|
0.9
|
7000
|
483
|
|
0.005"
|
Red
|
0.2–0.5
|
3.5
|
7000
|
483
|
|
0.007"
|
Yellow
|
0.5–1.5
|
8
|
7000
|
483
|
|
0.010"
|
Blue
|
1.0–10
|
13
|
7000
|
483
|
|
0.020"
|
Orange
|
10–30
|
50
|
7000
|
483
|
|
0.030"
|
Green
|
30–65
|
140
|
7000
|
483
|
|
0.040"
|
Brown
|
65–130*
|
250
|
5000
|
344
|
|
*For flows in this range, stainless steel tubing is recommended.
Pressures determined with water at room temperature.
|
|
|
|
|
|
Table 7: Tubing diameter and appropriate flow rate (mL/min). The “color” is associated with PEEK polymer tubing.